Qwen3.8-27B on a 24GB Mac: 3 Kernel Panics and the 17.76 GiB Limit Apple Doesn't Print
Your Mac has 24GB of RAM. Metal reports 17.76 GiB as the amount the GPU can use without hurting performance. Comparing a GGUF file size against total RAM is the wrong arithmetic, and that gap is where the kernel panics live. Measured on one M4 Pro, including the runs that failed.
Three kernel panics before it ran. And the fix every forum gives you makes it worse.
The short answer
If you take one thing from this page, take the number.
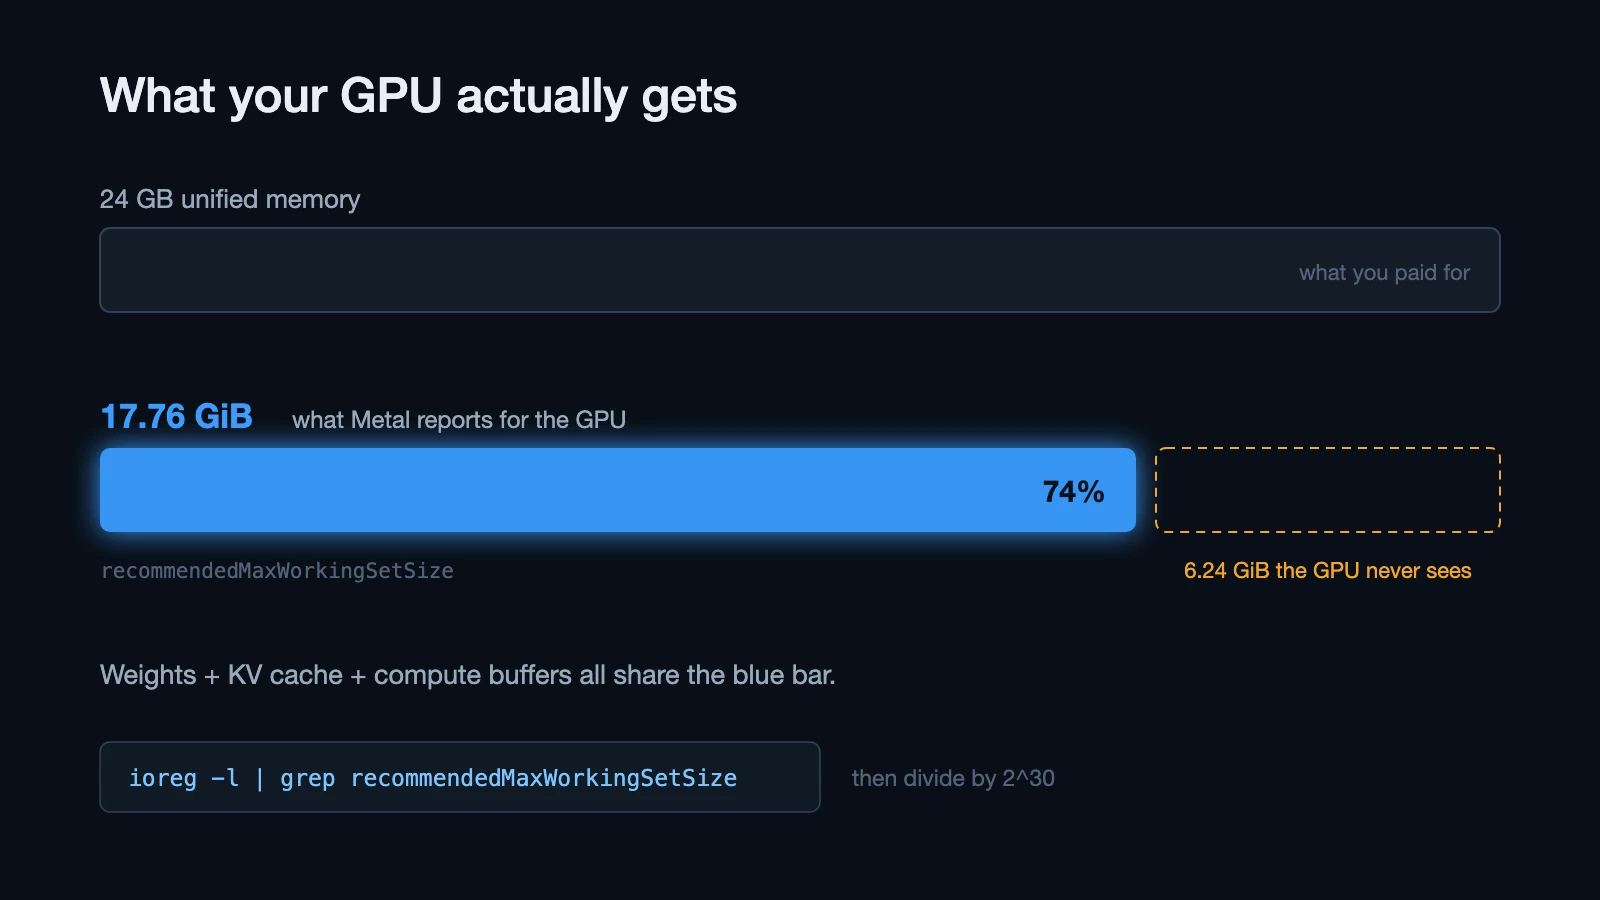
Your Mac has 24GB of unified memory. Metal reports 17.76 GiB as the amount the GPU can use before performance suffers. That is about 74% of what is on the box. Your model weights, your KV cache and your compute buffers all share that one budget.
Every guide that compares a GGUF’s file size against your total RAM is doing arithmetic against a number the GPU never sees.
| Machine | MacBook Pro M4 Pro, 24GB unified memory, 273 GB/s |
| Metal working set | 17.76 GiB (74% of RAM) |
| What crashed it | Q4_K_M, 15.3GB weights, 19.6GB peak, 110% of budget |
| The panic | IOGPUGroupMemory.cpp:528, WindowServer, hard reboot, 3 times |
| It was not OOM | Panic log: Compressor Info: 4% of compressed pages limit (OK) |
| The advice that backfired | Raising iogpu.wired_limit_mb made it worse |
| What works | UD-Q3_K_XL (12.2GB), 16k context, q4_0 KV cache |
| Speed | 12.60 tok/s decode on a clean machine, 21/21 objective tasks, 6/6 tool calling |
Check your own machine right now:
ioreg -l | grep recommendedMaxWorkingSetSizeDivide by 2^30. That is your real budget.
What Apple actually says
I want to be careful here, because the popular version of this claim is wrong in an important way.
People say macOS “caps GPU memory at 75%.” Apple does not describe it as a cap. Here is Apple’s own definition of recommendedMaxWorkingSetSize, verbatim:
An approximation of how much memory, in bytes, this GPU device can allocate without affecting its runtime performance.
And the guidance that follows it:
You can help the GPU maintain its performance by keeping the total memory footprint of its resources and heaps less than this threshold value.
So it is a performance threshold that Apple recommends you stay under, not a documented hard wall. That distinction matters, because it explains the failure mode. Nothing politely refuses your allocation at 17.76 GiB. You are allowed to walk past it. What you are walking into is undefined territory that Apple explicitly told you to stay out of, and on this machine that territory contains a driver bug.
llama.cpp reads this same property at startup and prints it in the log, which is why recommendedMaxWorkingSetSize is the number that governs whether your model loads.
The 74% table
Only one row of this table is mine. The 24GB figure is measured on the machine in front of me. The rest are that same 74% ratio applied to other capacities, which lines up with what people report but is arithmetic, not measurement:
| Your Mac | Expected GPU working set |
|---|---|
| 16 GB | ~11.8 GiB |
| 24 GB | 17.76 GiB (measured) |
| 36 GB | ~26.6 GiB |
| 48 GB | ~35.5 GiB |
| 64 GB | ~47.4 GiB |
Do not trust my table over your own machine. Run the ioreg command. The ratio shifts with macOS version and chip, and your number is the only one that governs your machine.
Why it panicked instead of failing politely
Q4_K_M is the quant everyone recommends. Its weights are 15.3GB, and by the time the vision projector and llama.cpp’s runtime buffers are resident it peaks at 19.6GB. That is 110% of everything the GPU is given.
It did not print an error. It took the machine down.
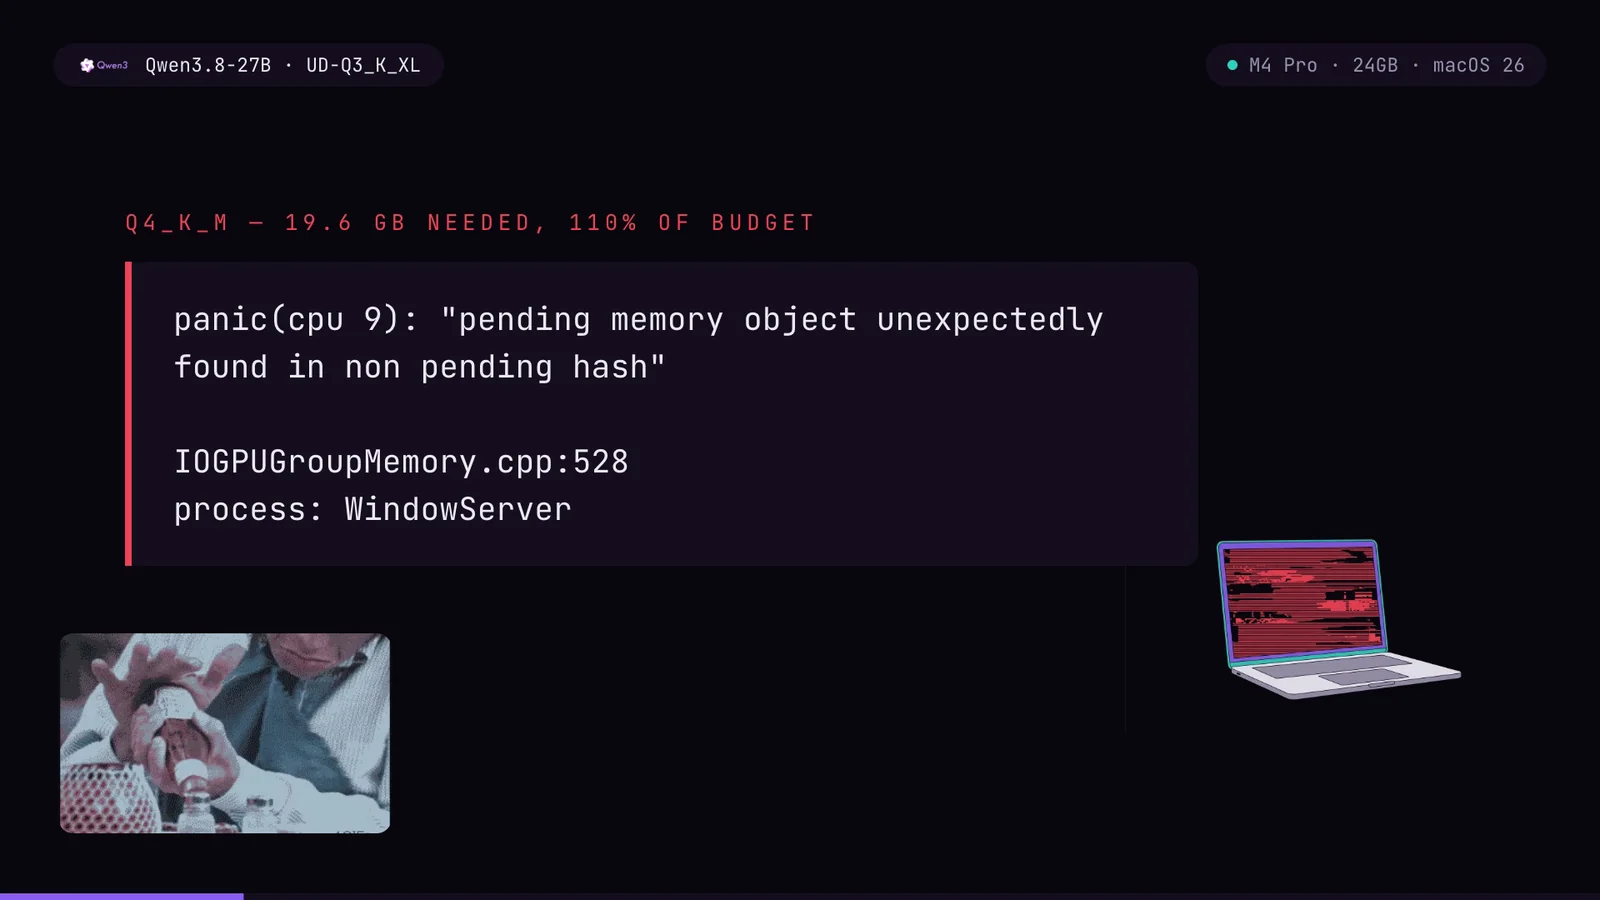
panic(cpu 9): "pending memory object unexpectedly found in non pending hash"
IOGPUGroupMemory.cpp:528
process: WindowServer
The important line is somewhere else in that log:
Compressor Info: 4% of compressed pages limit (OK)Four percent. The memory compressor was almost idle. This machine did not run out of memory. It hit a bug in Apple’s GPU driver, triggered by driving the working set to full.
This is not unique to me or to llama.cpp. The same class of failure is filed repeatedly against MLX: a kernel panic in IOGPUMemory.cpp on an M4 Max during a large context prefill, unbounded KV cache growth taking down a Mac Studio, and a 24GB Mac mini M4 panicking on Gemma 4 26B. The MLX thread states the mechanism plainly: the memory is wired, so macOS’s Jetsam out of memory killer cannot reclaim it and the system never even registers memory pressure.
That is the whole story. A normal process that asks for too much gets killed. A GPU allocation that asks for too much takes the kernel with it.
Why raising the wired limit makes it worse
The advice you will find on every forum is sudo sysctl iogpu.wired_limit_mb=<bigger number>. It is backwards, and I want to explain why rather than just assert it.
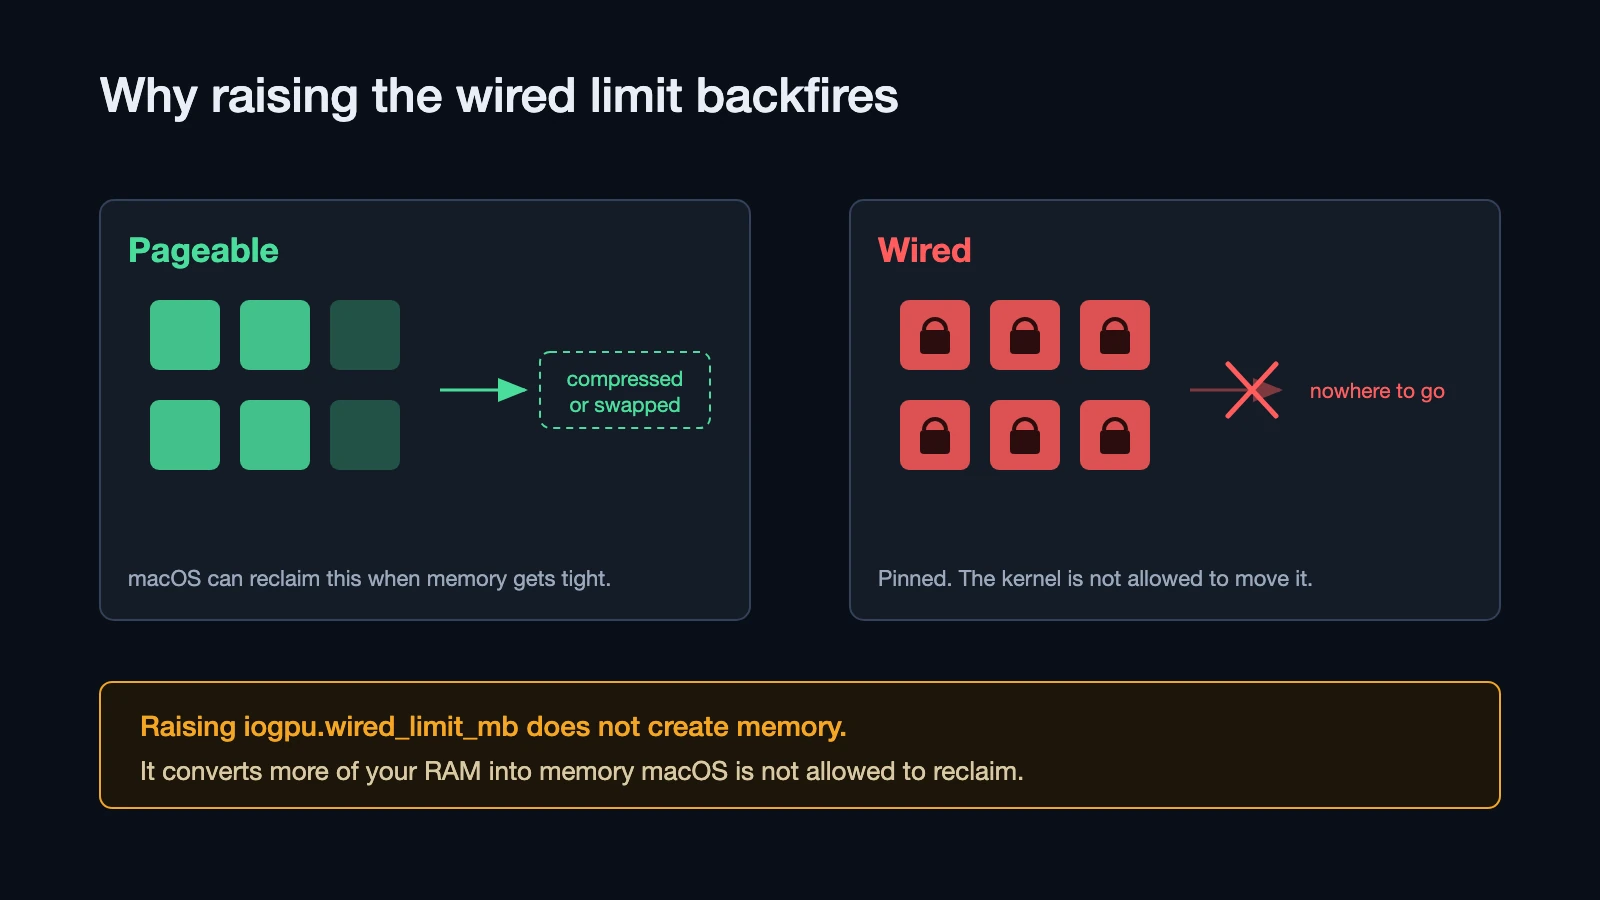
Normal memory is a car in a car park. If the system needs the space, it tows the car: pages get compressed, or written to swap, and the space comes back.
Wired memory is bolted to the ground. The kernel is not allowed to move it, compress it, or swap it out. That is the entire meaning of the word.
Raising the wired limit does not make the car park bigger. It bolts down more cars. You end up with less room to shuffle, not more, and you have removed macOS’s ability to dig itself out when things get tight.
I raised it because the forums said to. It panicked again.
The setting is not useless. On a machine with plenty of headroom, raising it lets a model load that otherwise would not. But it is the wrong tool for “my Mac keeps crashing,” because crashing is what happens when there is no headroom left, and this setting removes headroom.
How to read any GGUF quant name
Half of fitting a model on a Mac is knowing what you are downloading. UD-Q3_K_XL is not a random string.
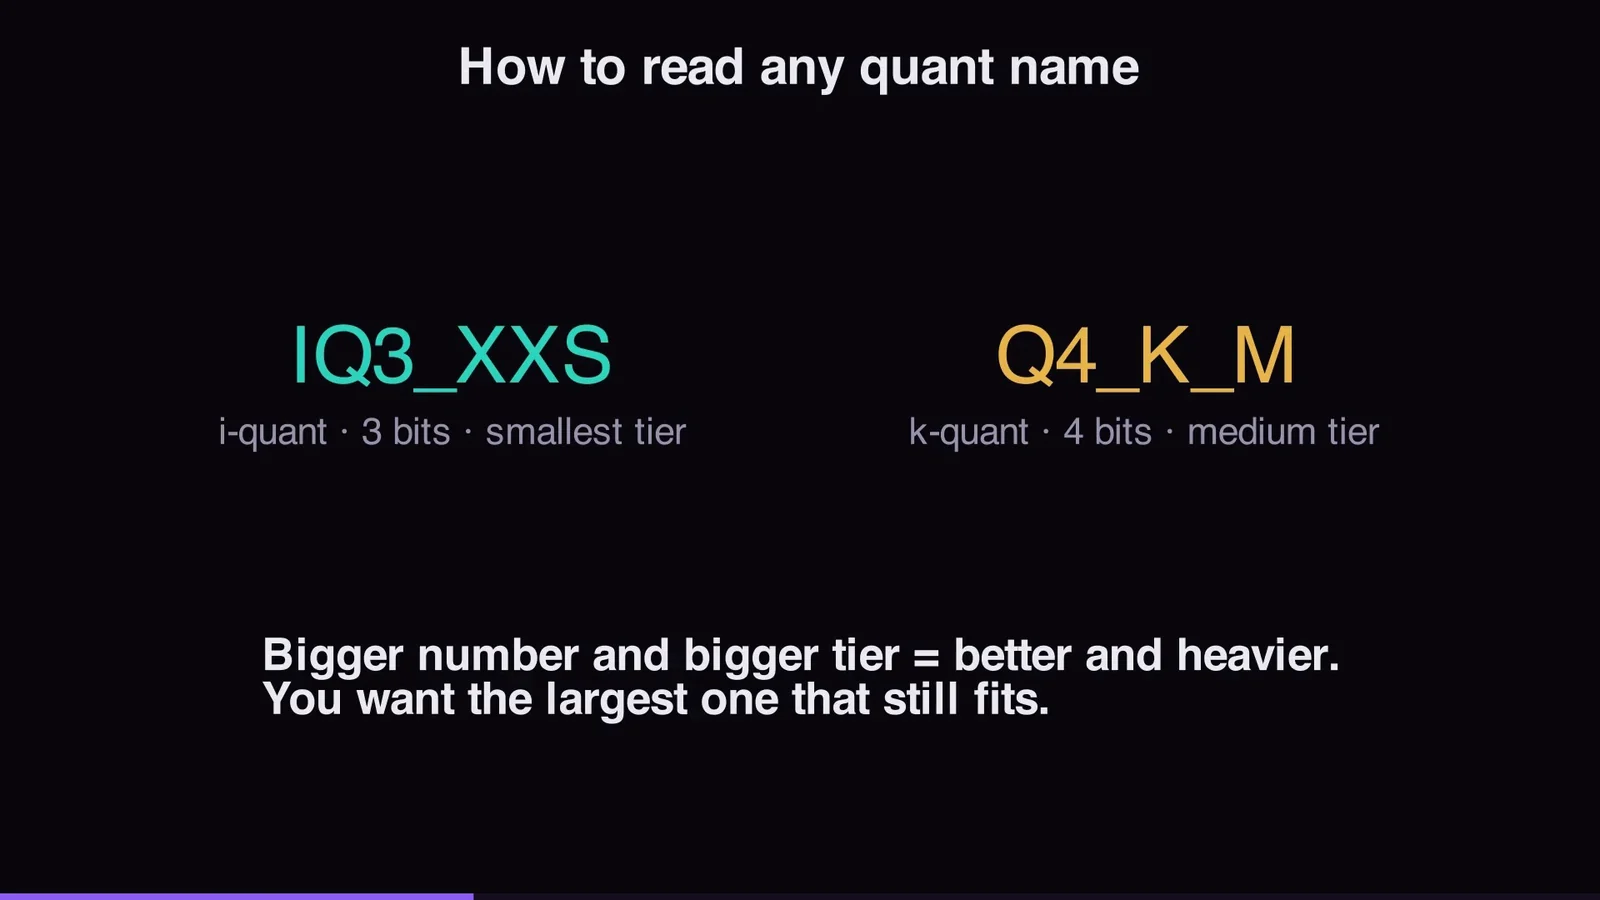
| Part | Meaning |
|---|---|
UD- | Unsloth Dynamic. The packer’s own recipe, where different layers get different bit counts. |
Q | Quantised. |
IQ | i-quant. Weights snap to a shared codebook instead of a simple scale. Smaller for the same quality, slower to dequantise. |
3, 4, 8 | Nominal bits per weight. |
_K | k-quant, the block scheme most GGUFs use. |
XS S M L XL | Size tier inside that bit count. |
Bigger number and bigger tier means better and heavier. You want the largest one that still fits, and “fits” means fits inside your working set number, not inside your RAM.
One correction worth making, because it trips people constantly: the I in IQ does not stand for importance matrix. The importance matrix is a separate calibration pass, and it is applied to k-quants and i-quants alike.
The part that grows while you talk
Weights are fixed the moment you choose a quant. The thing that grows is the KV cache: one key and one value per token, per layer, for every token in the context.
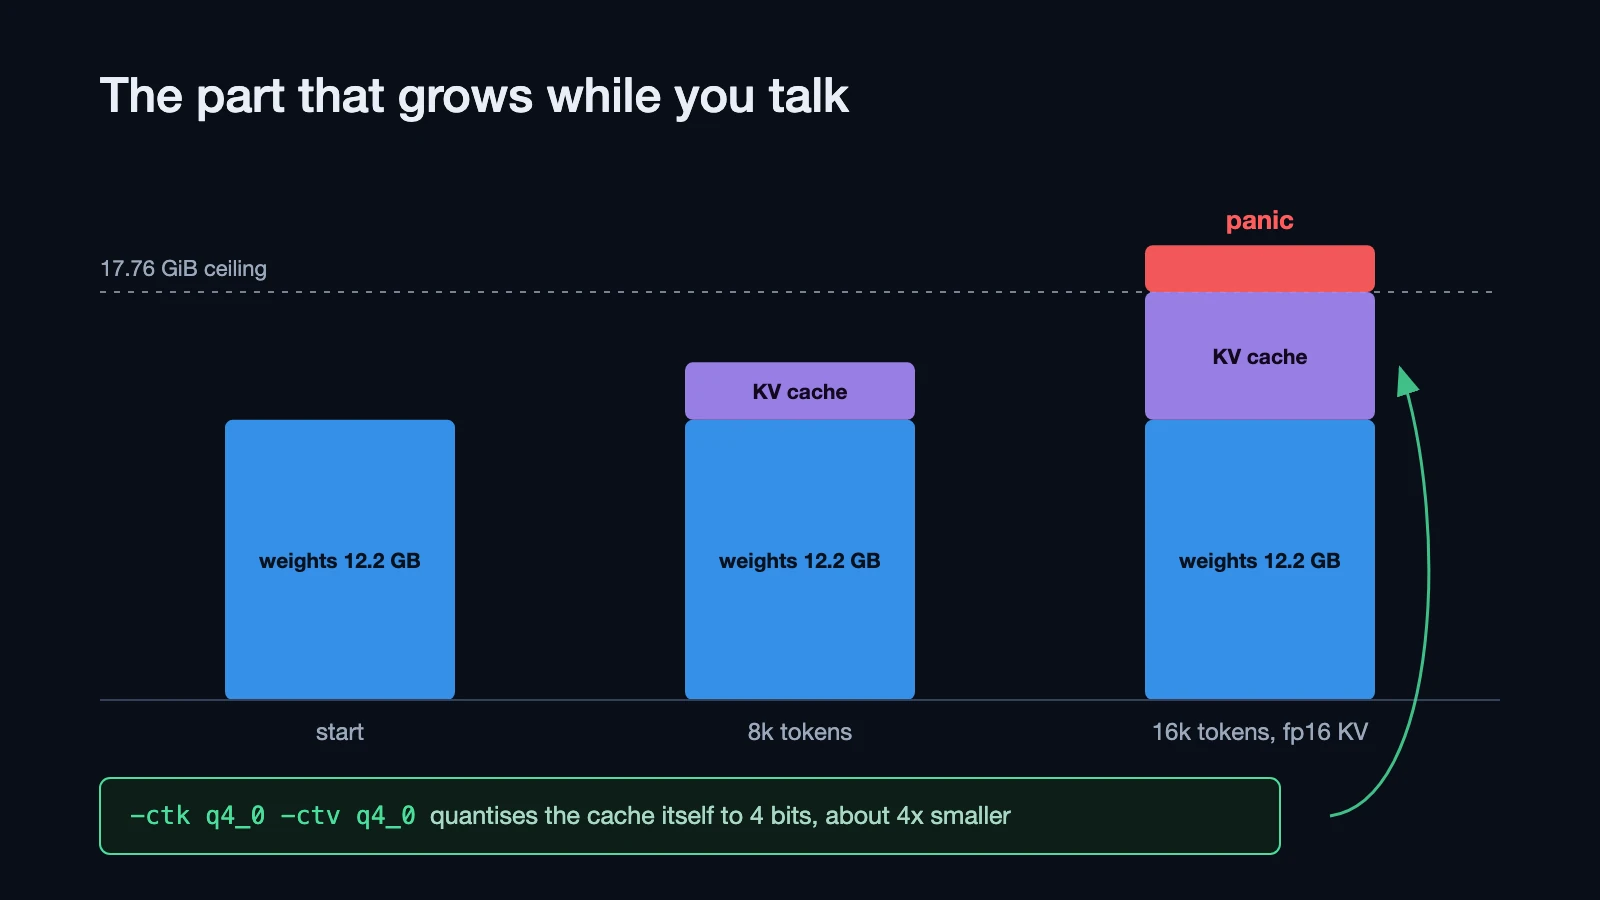
Sixteen thousand tokens of context is not free, and it is not paid once. It grows as the conversation grows, inside the same budget as your weights. This is exactly the failure in that MLX bug report: the cache grew until the driver faulted.
-ctk q4_0 -ctv q4_0That quantises the cache itself to 4 bits, roughly a 4x reduction. On this machine it is the difference between 16k context fitting and not fitting.
If you take a second thing from this page: on a memory constrained Mac, quantise your KV cache before you drop a quant tier on your weights. You lose far less.
Will it fit on your machine
I got tired of doing this arithmetic by hand, so I packaged it. It is on PyPI and the source is on GitHub.
pip install localfit
localfit qwen3.8-27b --gpu-gb 12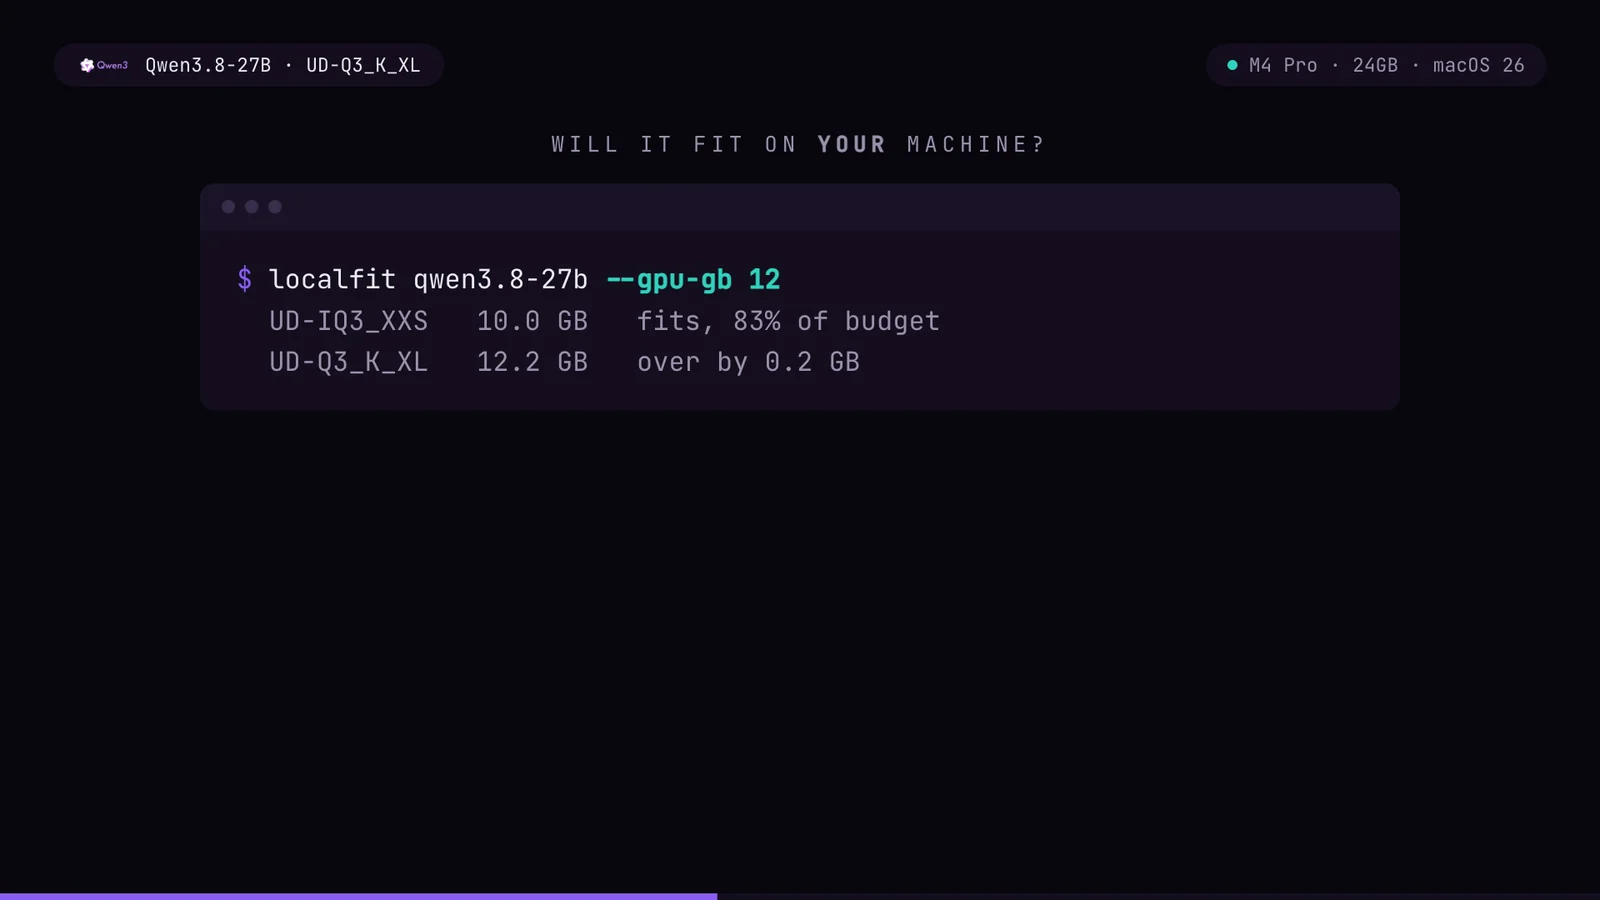
--gpu-gb scores every available quant against whatever budget you give it instead of mine. On a Mac, feed it the number from your own ioreg output.
Here is what it says for this model on this machine, at the full 17.76 GiB:
| quant | file size | peak | % of budget | verdict |
|---|---|---|---|---|
| IQ2_XXS | 6.8G | 9.8G | 54% | ok |
| Q2_K_XL | 9.2G | 12.5G | 70% | ok |
| IQ3_XXS | 10.2G | 13.7G | 77% | safe pick |
| IQ3_S | 11.2G | 14.8G | 83% | ok |
| UD-Q3_K_XL | 12.2G | 16.0G | 90% | danger |
| IQ4_XS | 13.3G | 17.3G | 97% | danger |
| Q4_K_M | 15.3G | 19.6G | 110% | over |
| Q8_0 | 27.1G | 33.2G | 186% | over |
| BF16 | 50.9G | 60.7G | 341% | over |
The quant everyone recommends, Q4_K_M, cannot load. Its weights alone are 15.3GB and its peak is 110% of everything the GPU is given.
Peak is weights plus the vision projector plus runtime overhead, measured on this machine at 1.154x file size. It is an estimate, and further down I show it running about two points optimistic against what the machine actually wires.
Free the memory first
At 85% of budget, everything else on your desktop matters. This is not housekeeping advice, it is the difference between running and rebooting.
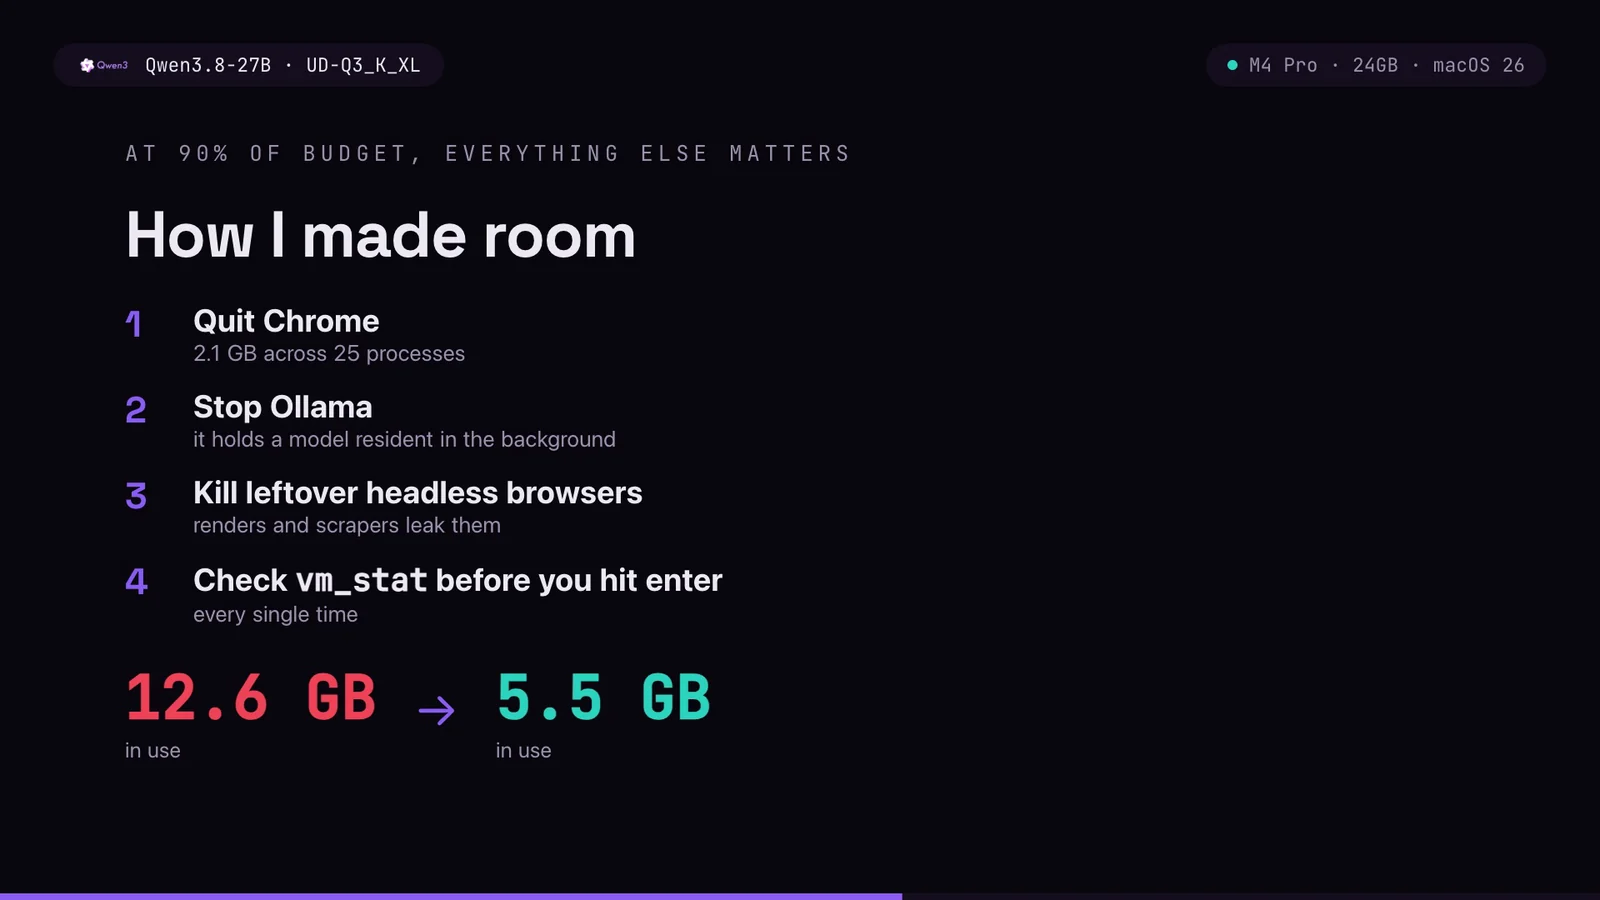
- Quit Chrome. 2.1 GB across 25 processes on my machine.
- Stop Ollama. It keeps a model resident in the background.
- Kill leftover headless browsers. Renderers and scrapers leak them.
- Check
vm_statbefore you hit enter. Every single time.
12.6 GB in use down to 5.5 GB in use. That is most of a quant tier, for free.
And it is not only about whether the model loads. The 11.26 tok/s run above is the same configuration as the 12.60 run, on the same laptop, with the only difference being 4.15GB of swap left over from a long working session. Eleven percent of your throughput can be sitting in a browser you forgot about.
What it actually scored
Everything below was measured on the one machine, with the scripts published.
| Decode, UD-Q3_K_XL, clean machine | 12.60 tok/s |
| Decode, IQ4_XS, clean machine | 12.87 tok/s |
| Decode, same config with 4.15GB of swap | 11.26 tok/s |
| Prefix cache | 14.2x, 47.907s down to 3.371s on 4,826 tokens |
| Objective tasks | 21/21 |
| Tool calling | 6/6 |
| Wired memory, text only | 16.37 GiB, 92% of budget |
| Wired memory, after a vision pass | 16.78 GiB, 94% of budget |
That third row is not noise, it is the point. Same model, same flags, same machine, 11% slower purely because the box was carrying 4.15GB of swap after a long session with Android Studio and Xcode open. I am not presenting it as a reproduction of the 12.60 figure, I am presenting it as the cost of a dirty machine.
I also threw away a run that reported 5.168 tok/s, because a stray background benchmark was hitting the same server and two clients were competing for it. Contention alone halved the number. If you benchmark a local model without checking what else is talking to it, that is the size of error you are risking.
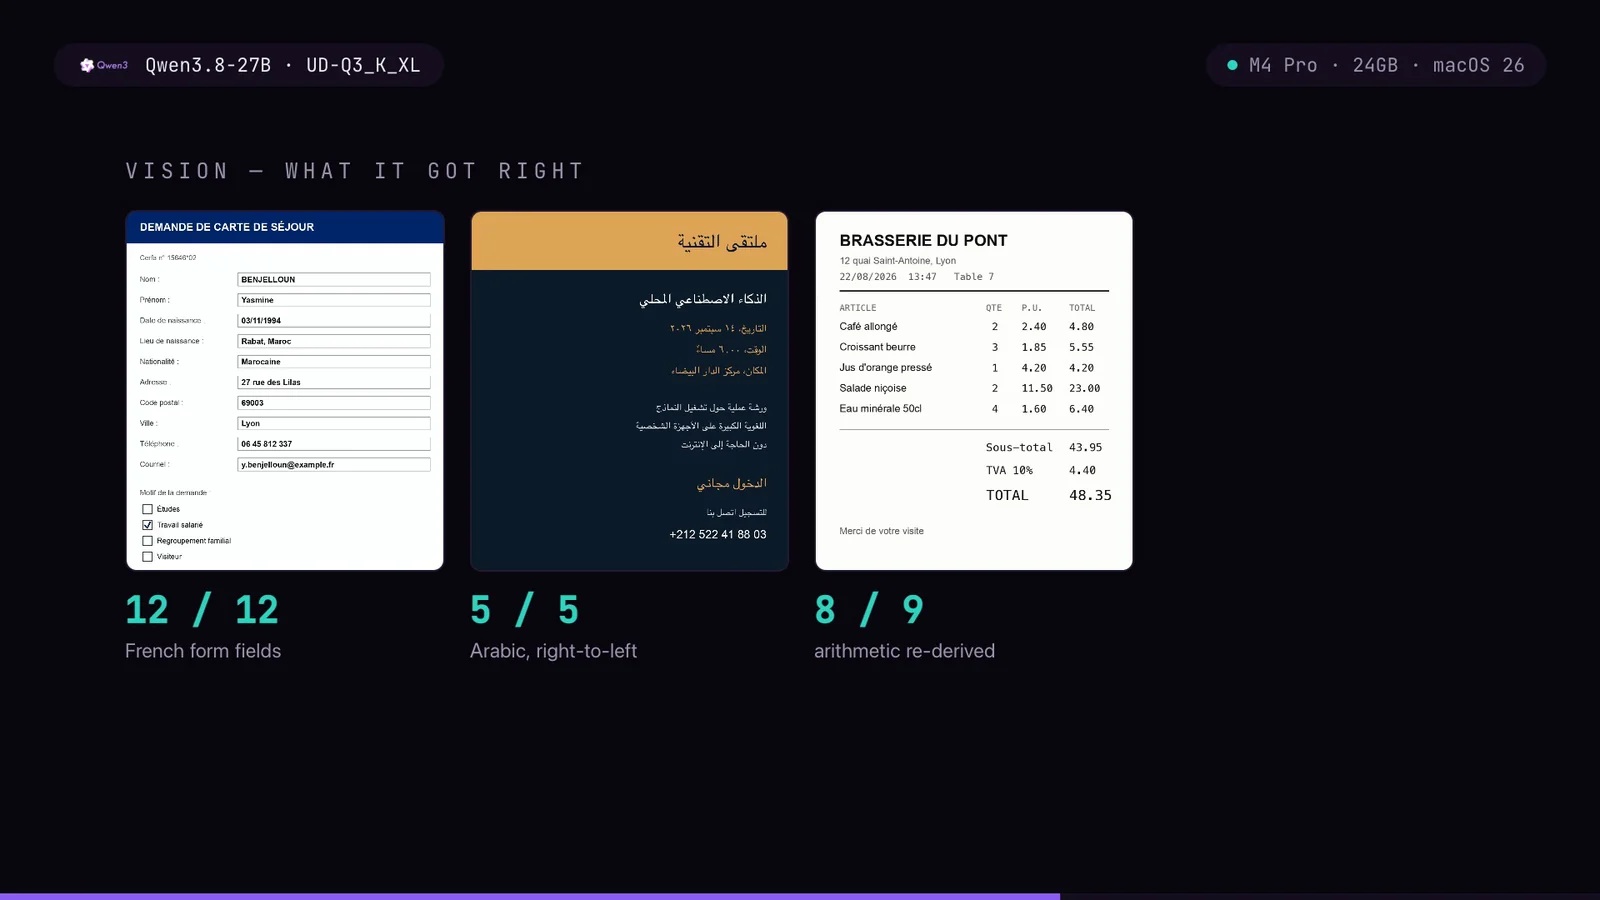
Those 21 objective passes include the vision set: every field of a French administrative form, an Arabic flyer read right to left, and a receipt whose arithmetic it re-derived rather than copied. It missed one line of the receipt.
The estimate is optimistic, so measure
This is the part I would most want someone to take away, because it nearly caught me out.
The fit tool estimates Q3_K_XL at 90% of budget. Then I measured what the machine actually wires with that exact config loaded:
| Moment | Wired | % of 17.76 GiB |
|---|---|---|
| Text only, right after load | 16.37 GiB | 92% |
| After a vision pass | 16.78 GiB | 94% |
| After killing the server | 2.82 GiB | 16% |
So the recommended, conservative, “safe” configuration lives at 92% and touches 94% the moment you show it an image. That is the panic zone. It ran without crashing across every test on this page, and I would not describe it as comfortable.
Two conclusions follow. First, treat any fit estimate as a floor, not a ceiling, and verify with real numbers before you trust it. Second, this is why IQ4_XS is not the recommendation despite being marginally faster: its estimate is 97%, and if the estimate runs two points light there, the measurement is past 100%.
Smaller is not faster
I expected dropping a tier to buy speed. It does not. IQ4_XS is 1.1GB larger than Q3_K_XL and slightly faster. K-quant dequantisation costs about as much compute as the bandwidth it saves, and on Apple Silicon those roughly cancel. Dropping a tier buys you headroom, not throughput, which is a fine reason to do it and a bad reason to expect speed.
Why 12.60 and not the 40 tok/s people post
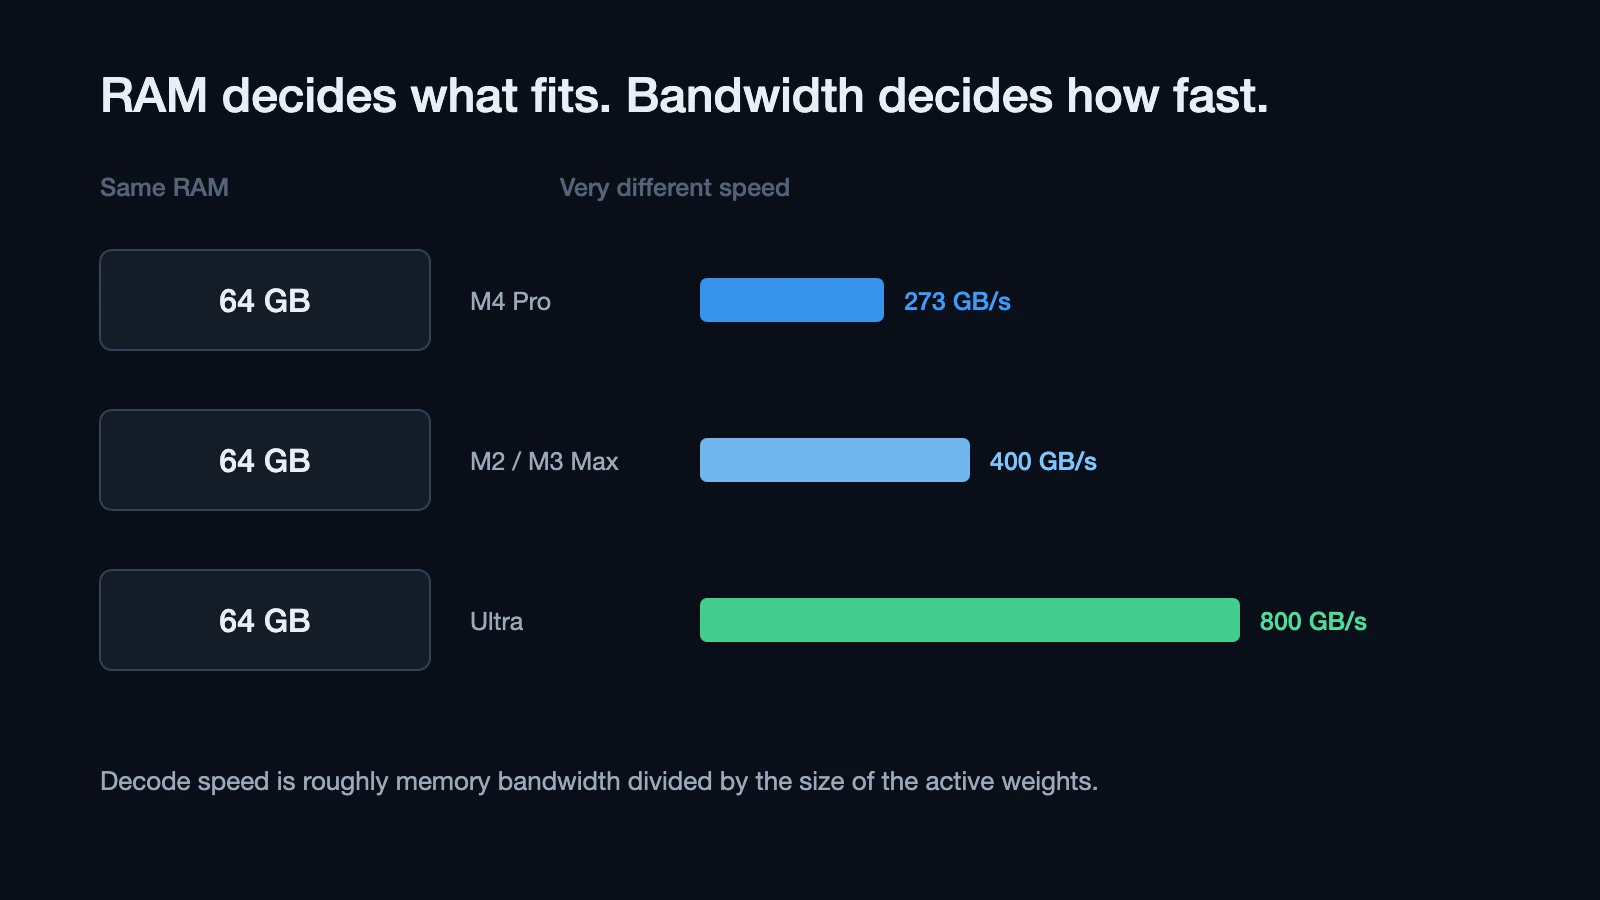
Bandwidth. An M4 Pro moves 273 GB/s. An RTX 5070 Ti moves 896 GB/s. Scale the 40 to 50 tok/s people report on that card by 273/896 and you predict 12.2 to 15.2 tok/s. Measured: 12.60.
There was never 40 tok/s available on this laptop. Capacity decides what fits. Bandwidth decides how fast. Those are two separate limits and conflating them is why so many “why is my Mac so slow” threads never resolve.
Where I was wrong, on the record
One task scored 5/6 because the model answered "os\.system" where my fixture expected "os.system". The tool’s own description says the argument is a regex, so the escaped dot is correct and the bare one was my sloppy fixture. The model was right and my grader was broken. The score is 6/6.
I mention it because a benchmark that never finds its own author wrong is not a benchmark.
What I run on top of it
A model at 12.60 tok/s is only useful if the thing driving it does not waste tokens. I tested two local coding agents against this exact server, same machine, same instruction: build a self-contained landing page.
| Harness | System prompt | Wall time | Result |
|---|---|---|---|
| pi-rust v0.1.23 | ~1.7 to 2.8k tokens | 219s | wrote it, 4.8 KB |
localcoder --compact | 2,154 tokens | 509s | wrote it, 5.6 KB |
Both finished. The gap is not intelligence, it is overhead, and this is the number nobody reports when they benchmark a local model: the harness spends your tokens before your prompt does. At 12.60 tok/s you feel every one of them.
This is also why llama.cpp beats MLX for agents despite being less than half the speed. MLX with speculative decoding hits 32.0 tok/s against llama.cpp’s 12.9, which is a real 2.5x. But llama.cpp caches the prompt prefix and answers a repeated system prompt in 0.4s, where MLX re-prefills roughly 5s every single turn. An agent resends that same system prompt forever, so a 12x saving on every turn beats a 2.5x saving on the tokens.
localcoder is the one I keep, because it runs entirely offline with no API keys, and it is on GitHub and PyPI.
It can drive a television
Fitting a model is only interesting if the model then does something. I gave this one three tools over MCP and a plain English rules file, and pointed it at a Sony Bravia over adb.
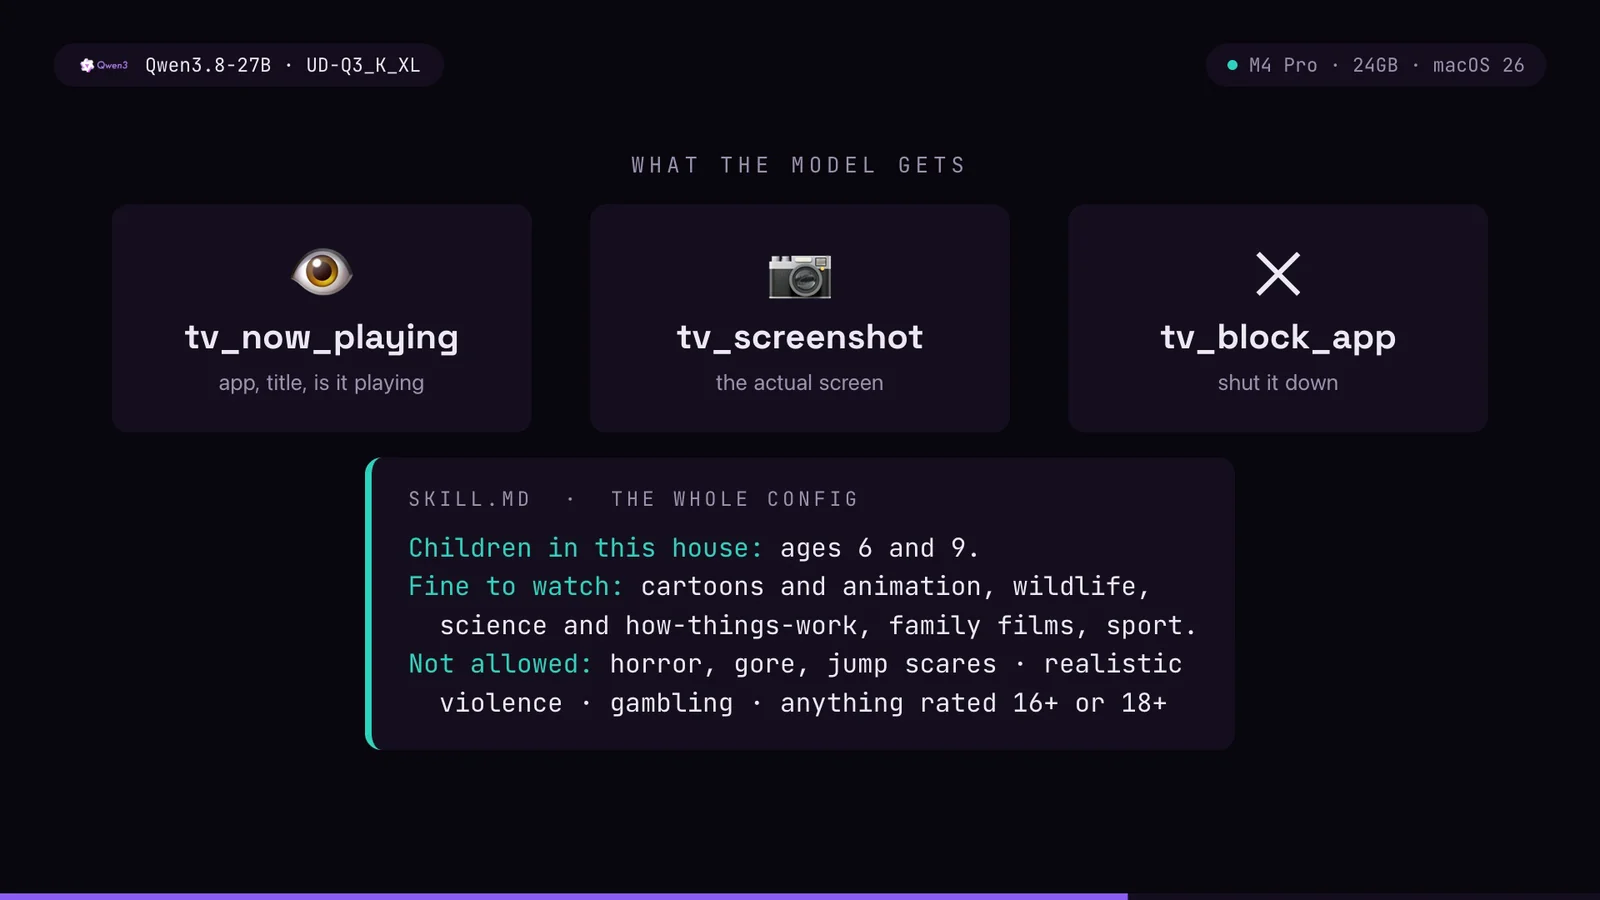
The tools: read what is playing, screenshot the screen, force-stop the app. The rules file is the sort of thing a parent would write, in sentences, not config.
It read the title, looked at the frame, and caught the metadata lying twice in one run. A video titled “clips that made iShowSpeed famous” was a Fortnite lobby. One titled “TOM HOLLAND LAUGHING #meme” was something else entirely. Both blocked, on the evidence of the frame rather than the label.
One block does not hold. Measured: at +4s the app is dead and the TV is on its launcher, at +8s the app relaunches itself, at +20s playback is restored. A single check is theatre. It has to keep checking, and each check costs 23 to 718 seconds depending on how many tool calls it makes. That makes it a patrol, not a guard, and the honest version of this product is a patrol.
Can llama.cpp do video, locally
Qwen3.8-27B supports video natively. llama-server rejects it:
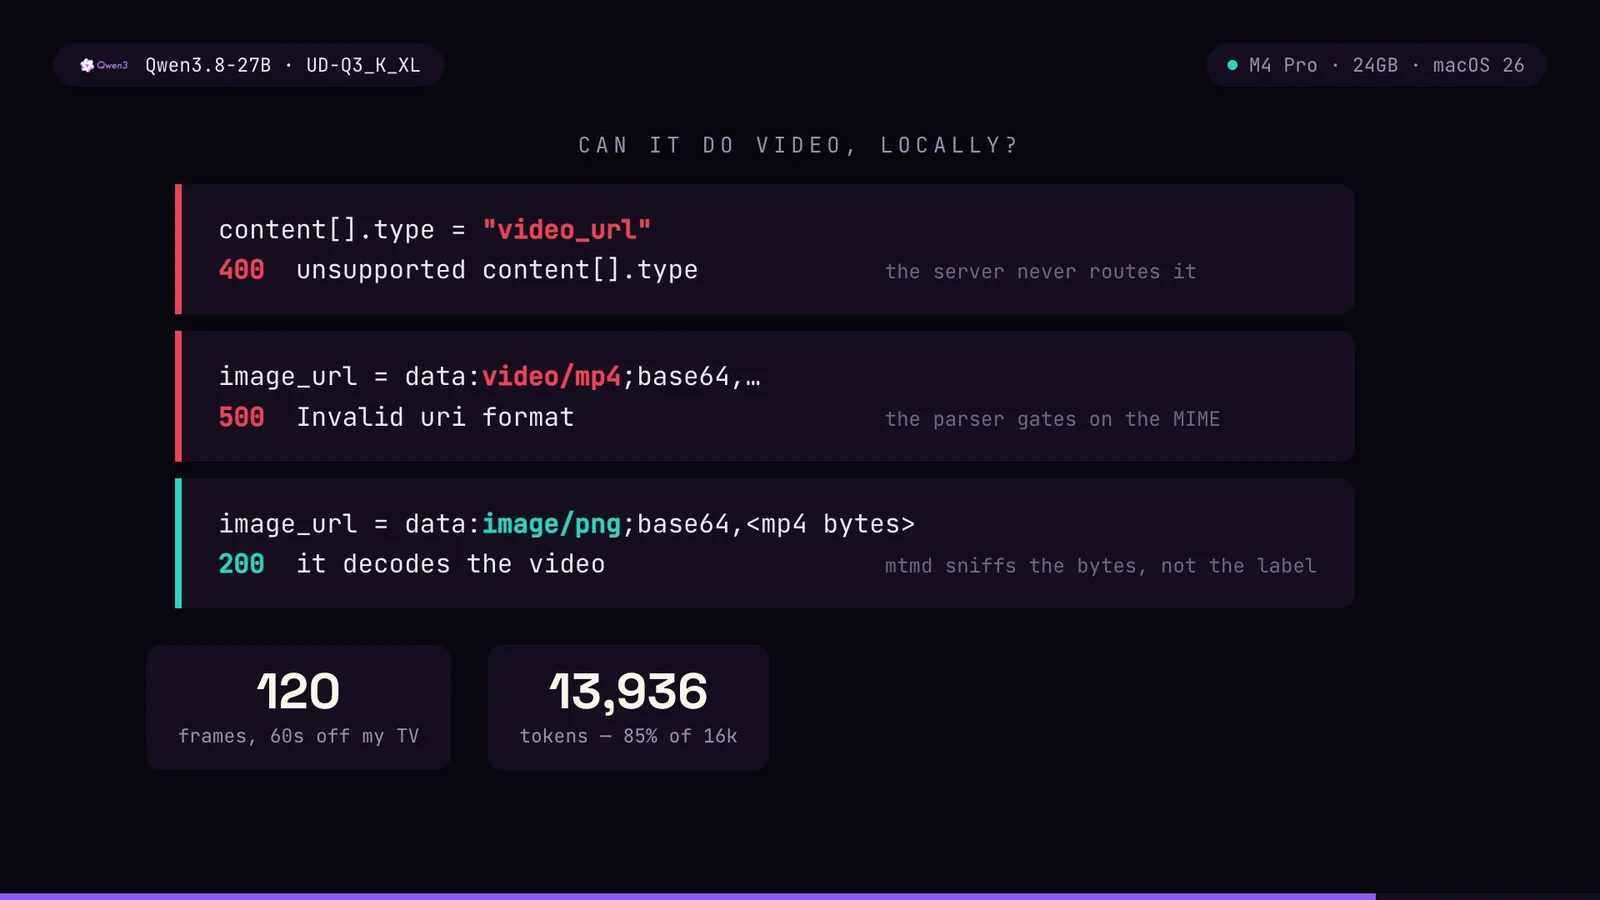
content[].type = "video_url"        ->  400  unsupported content[].type
image_url = data:video/mp4;base64   ->  500  Invalid uri format
But the decoder is in the build. libmtmd ships mtmd_helper_video_init and shells out to ffmpeg. The server simply never routes that content type to it, and the URI parser gates on the MIME string while mtmd sniffs the actual bytes. So this works:
{"type": "image_url",
 "image_url": {"url": "data:image/png;base64," + base64_of_your_mp4}}
It decodes. Measured ceiling on this laptop: roughly 240 tokens per second of video, about 3.3s of compute per second of video, and 60 seconds of footage consumes 85% of a 16k context. The practical wall is around 70 seconds.
The model card advertises hour scale video. That needs roughly 224k video tokens, about 14x more context than fits here. Hour scale is real, it is just not real on 24GB.
This is a workaround against a parser gap, not an API. It will stop working the day the server routes video_url properly, which is the actual fix.
Local versus cloud, on one clip
Same 4 seconds of Big Buck Bunny (CC-BY, Blender Foundation), same question: what animal is in the burrow?
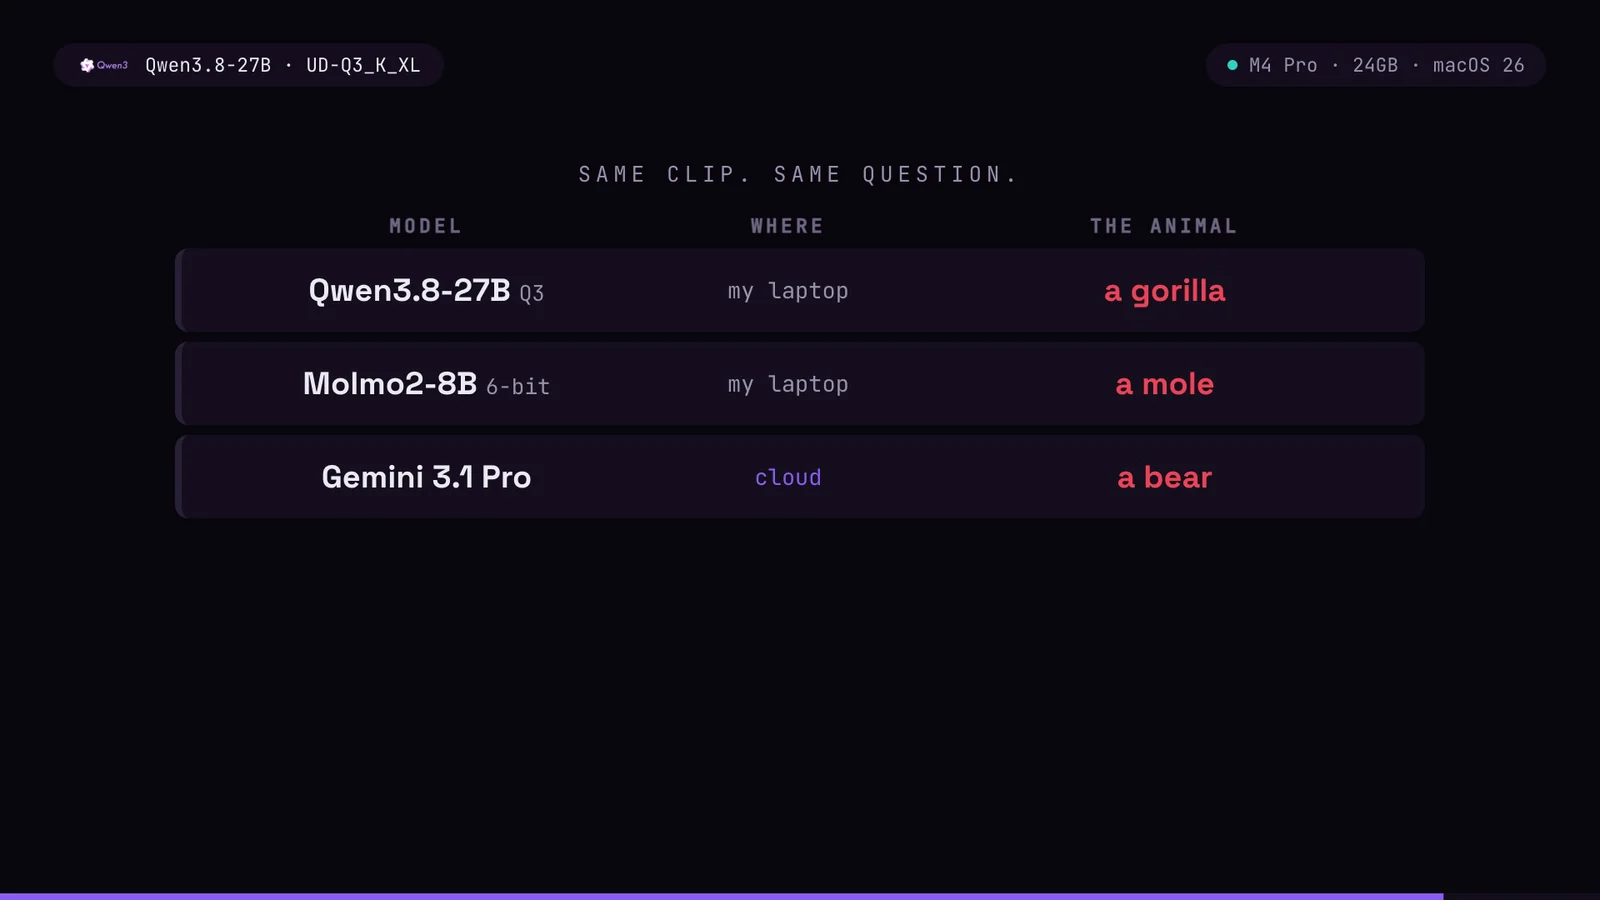
| Model | Where | The answer |
|---|---|---|
| Qwen3.8-27B Q3 | my laptop | a gorilla, wrong |
| Molmo2-8B 6-bit | my laptop | a mole, wrong |
| Gemini 3.1 Pro | cloud | a bear, wrong |
| Gemini 3.7 Flash | cloud | a large rabbit, correct |
It is a rabbit. Only Flash got it. Everyone else saw a dark shape in a hole and guessed a furry mammal, which is a sensible prior and still wrong.
Worth noting what they all did get: every model correctly described the camera push-in and the ordering of events. Watching is not the hard part. Identifying a shape in shadow is.
Two traps I fell into first, and both flattered the local model
- I left thinking on for Gemini and off for Qwen.
gemini-flash-latestresolves togemini-3.7-flashand spent 272 thought tokens on a task where the local model was answering cold. Settingthinking_budget=0does not reliably stop it either. - Gemini was silently on low
media_resolution. Four frames at 66 tokens each, against Qwen’s 8 frames at 448px for 1,070 tokens. A quarter of the pixels. Low is the default on that path and nothing warns you.
Check both before you compare anything to anything. I had to publish a correction because I did not.
Always run a no-input control
I published a Molmo2-8B result, 1.7s and a plausible answer, before discovering the model had received no frames at all. The same prompt with no video returned the identical sentence, word for word. “Badger” came from the word burrow in my own question.
mlx_vlm 0.6.14 builds the prompt as a bare string, so Molmo2’s chat template never emits <|video|>, and its processor cannot encode video regardless. generate() accepts video=[...] and drops it silently, with no warning. The image path with pre-sampled frames works, and costs 15.9s rather than 1.7s.
Any evaluation without a no-input control is measuring the language prior, not the vision. If your model answers just as well with the input removed, you have not tested what you think you tested.
What I would actually run
llama-server -m Qwen3.8-27B-UD-Q3_K_XL.gguf \
  --mmproj mmproj-F16.gguf \
-ngl 99 -c 16384 -fa on -ctk q4_0 -ctv q4_0 --jinjaUD-Q3_K_XL, 16k context, flash attention on, q4_0 KV cache. 12.60 tok/s on a clean machine, everything fits, nothing panicked across every test on this page.
IQ4_XS is the better quant on paper and marginally faster in practice, and I still do not run it. Q3_K_XL already measures 92% wired and 94% after a vision pass. IQ4_XS estimates at 97%, and the estimate runs light.
If your Mac has 16GB, the honest answer is that 27B is not your model. Use the table, pick something that lands under 75% of your own number, and you will have a machine that stays up.
Frequently asked questions
How much VRAM does a 24GB Mac give the GPU?
On a 24GB M4 Pro, Metal reports recommendedMaxWorkingSetSize as 17.76 GiB, about 74% of unified memory. Apple defines it as an approximation of how much the GPU can allocate without affecting runtime performance. Check yours with ioreg -l | grep recommendedMaxWorkingSetSize and divide by 2^30.
Can Qwen3.8-27B run on a 24GB MacBook?
Yes, at UD-Q3_K_XL (12.2GB) with 16k context and a q4_0 KV cache, at 12.60 tok/s. Not at Q4_K_M, which peaks past the budget and panicked this machine three times.
Does raising iogpu.wired_limit_mb fix crashes?
No. It made mine worse. Wired memory cannot be paged out, so raising the limit converts more of your RAM into memory macOS is not allowed to reclaim. That is less headroom, not more.
Why a kernel panic instead of an out of memory error? GPU allocations are wired, so the Jetsam out of memory killer cannot reclaim them and never fires. The driver faults before macOS registers pressure. My panic log showed the compressor at 4% of its limit, marked OK.
What tok/s should I expect from a 27B on Apple Silicon? Roughly bandwidth divided by the size of the active weights. 273 GB/s against a 12.2GB quant gave 12.60 tok/s on a clean machine and 11.26 on the same machine carrying 4.15GB of swap. RAM decides what fits, bandwidth decides how fast, and a 64GB M4 Pro has the same 273 GB/s as a 24GB one.
Is MLX faster than llama.cpp here? For chat, yes. MLX with MTP speculative decoding hit 32.0 tok/s against llama.cpp’s 12.9. For agents, no, and it is not close: llama.cpp caches the prompt prefix and re-answers in 0.4s where MLX re-prefills roughly 5s every single turn. An agent resends the same system prompt forever, so a 12x saving beats a 2.5x one.
Sources and further reading
- Apple,
recommendedMaxWorkingSetSize, MTLDevice - Apple,
hasUnifiedMemory, MTLDevice - ml-explore/mlx #3186, kernel panic in IOGPUMemory.cpp on large prefill
- ml-explore/mlx-lm #883, kernel panic from unbounded KV cache growth
- Part 1: the Gemma 4 26B version of this problem
- Every Gemma 4 model, tested locally
- localfit on GitHub and on PyPI, to score quants against your own budget rather than mine
- localcoder on GitHub and on PyPI, a coding agent that runs against a local server with no API keys
Measured on a MacBook Pro M4 Pro, 24GB, macOS 26, llama.cpp b10520. If your numbers differ, run ioreg first and tell me what it says.
Newsletter
Get the next post and game in your inbox
One email when I publish something new: measured write-ups on AI, local models and cloud, plus games like NEON RUN.